Center for Health
and the Global
EnvironmentClimate Health and Risk Tool
Center for Healthand the Global
EnvironmentClimate Health and Risk Tool


Photo: John Towner
WA Legislative Districts Historical Heat-Health Risks
4 Models
Sort by:
namedate
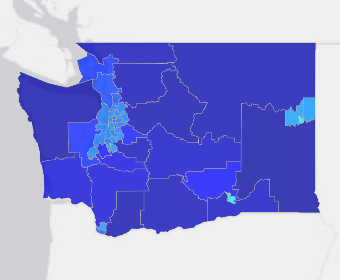
WA Legistaltive Districts Heat Health Risk - 1991-2020 - Hottest 30 days of each year (version 5.1)for Washington State
created 09/21/2023 by Tim Sheehan, Alyssa Miller, Jeremy Hess
created 09/21/2023 by Tim Sheehan, Alyssa Miller, Jeremy Hess
This model characterizes the most intense long-duration risk by considering the hottest thirty days for each reporting unit in each year between 1991 and 2020.
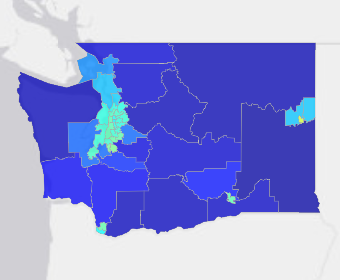
WA Legislative Districts Heat Health Risk - 1991-2020 - Hottest 3 days of each year (version 5.1)for Washington State
created 09/21/2023 by Tim Sheehan, Alyssa Miller, Jeremy Hess
created 09/21/2023 by Tim Sheehan, Alyssa Miller, Jeremy Hess
This model characterizes the most intense short-term risk by considering the hottest three days for each reporting unit in each year between 1991 and 2020.
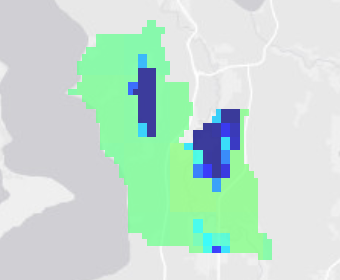
WA Legislative District 15 Heat Health Risk - 1991-2020 - Hottest 3 days of each year (version 5.1)for Washington State
created 12/05/2022 by Tim Sheehan, Alyssa Miller, Jeremy Hess
created 12/05/2022 by Tim Sheehan, Alyssa Miller, Jeremy Hess
This model characterizes the most intense short-term risk by considering the hottest three days for each reporting unit in each year between 1991 and 2020.
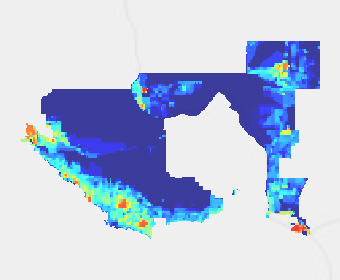
WA Legislative District 33 Heat Health Risk - 1991-2020 - Hottest 3 days of each year (version 5.1)for Washington State
created 12/05/2022 by Tim Sheehan, Alyssa Miller, Jeremy Hess
created 12/05/2022 by Tim Sheehan, Alyssa Miller, Jeremy Hess
This model characterizes the most intense short-term risk by considering the hottest three days for each reporting unit in each year between 1991 and 2020.