Center for Health
and the Global
EnvironmentClimate Health and Risk Tool
Center for Healthand the Global
EnvironmentClimate Health and Risk Tool


Photo: John Towner
Explore models by geography
geographies: King County, WA (1), Pierce County, Washington (1), Washington State (18)King County, WA
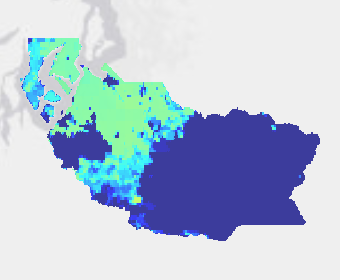
(showing 1 of 1)King County Washington Tree planting Priority - 2036-2065 - Hottest 3 days of each year (15 arcsecond grid) (version 5.00)for King County, WA
created 07/11/2023 by Tim Sheehan, Jeremy Hess
created 07/11/2023 by Tim Sheehan, Jeremy Hess
Unvetted, example model for tree planting priority in King County, Washington State based on heat-health risk determined using the hottest 3 days of each reporting unit over the period 1990-2020
Pierce County, Washington
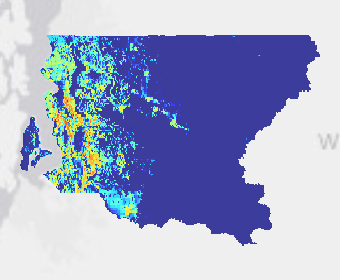
(showing 1 of 1)Pierce County, WA Heat Health Risk - 1991-2020 - Hottest 3 days of each year (15 arcsecond grid) (version 5.00)for Pierce County, Washington
created 03/22/2023 by Tim Sheehan, Alyssa Miller, Jeremy Hess
created 03/22/2023 by Tim Sheehan, Alyssa Miller, Jeremy Hess
This model characterizes the most intense short-term risk by considering the hottest three days for each reporting unit in each year between 1991 and 2020 for Pierce County, WA.
Washington State
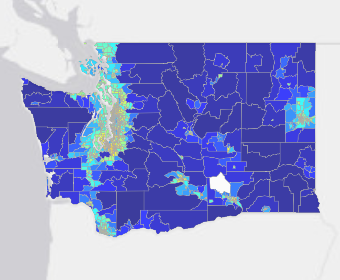
(showing 3 of 18)WA Census Tracts Heat Health Risk - 1991-2020 - Hottest 30 days of each year (version 5.1)for Washington State
created 09/21/2023 by Tim Sheehan, Alyssa Miller, Jeremy Hess
created 09/21/2023 by Tim Sheehan, Alyssa Miller, Jeremy Hess
This model characterizes the most intense long-duration risk by considering the hottest thirty days for each reporting unit in each year between 1991 and 2020.
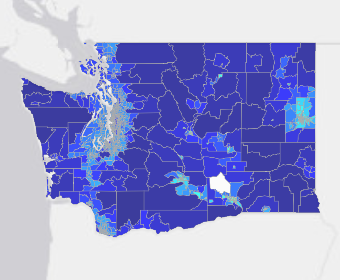
WA Census Tracts Heat Health Risk - 1991-2020 - Hottest 3 days of each year (version 5.1)for Washington State
created 09/21/2023 by Tim Sheehan, Alyssa Miller, Jeremy Hess
created 09/21/2023 by Tim Sheehan, Alyssa Miller, Jeremy Hess
This model characterizes the most intense short-term risk by considering the hottest three days for each reporting unit in each year between 1991 and 2020.
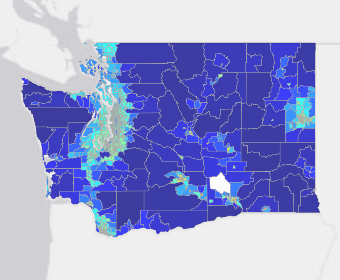
WA Census Tracts Heat Health Risk - 2021-06-28 (version 5.1)for Washington State
created 09/21/2023 by Tim Sheehan, Alyssa Miller, Jeremy Hess
created 09/21/2023 by Tim Sheehan, Alyssa Miller, Jeremy Hess
This model characterizes daily heat health risk on June 28, 2021 during the heat dome event.