Center for Health
and the Global
EnvironmentClimate Health and Risk Tool
Center for Healthand the Global
EnvironmentClimate Health and Risk Tool


Photo: Parsing Eye
Washington State
18 Models
Sort by:
namedate
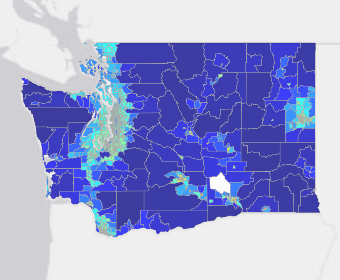
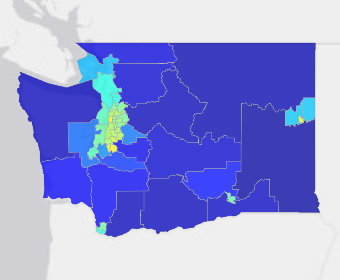
WA Census Tracts Heat Health Risk - 1991-2020 - Hottest 30 days of each year (version 5.1)for Washington State
created 09/21/2023 by Tim Sheehan, Alyssa Miller, Jeremy Hess
created 09/21/2023 by Tim Sheehan, Alyssa Miller, Jeremy Hess
This model characterizes the most intense long-duration risk by considering the hottest thirty days for each reporting unit in each year between 1991 and 2020.

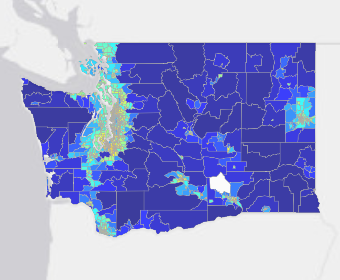
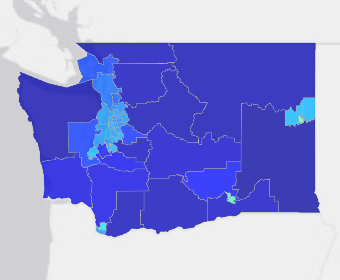
WA Census Tracts Heat Health Risk - 1991-2020 - Hottest 3 days of each year (version 5.1)for Washington State
created 09/21/2023 by Tim Sheehan, Alyssa Miller, Jeremy Hess
created 09/21/2023 by Tim Sheehan, Alyssa Miller, Jeremy Hess
This model characterizes the most intense short-term risk by considering the hottest three days for each reporting unit in each year between 1991 and 2020.
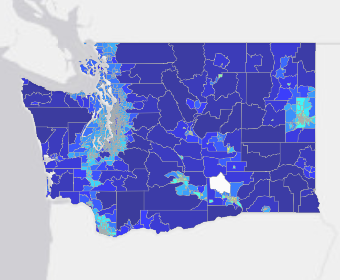
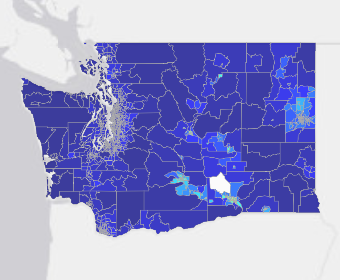
WA Census Tracts Heat Health Risk - 2021-06-28 (version 5.1)for Washington State
created 09/21/2023 by Tim Sheehan, Alyssa Miller, Jeremy Hess
created 09/21/2023 by Tim Sheehan, Alyssa Miller, Jeremy Hess
This model characterizes daily heat health risk on June 28, 2021 during the heat dome event.
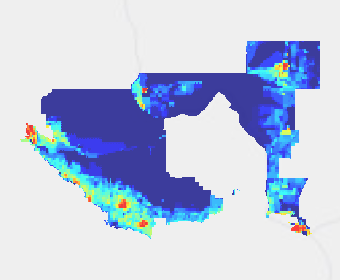
WA Census Tracts Heat Health Risk - 2036-2065 - Hottest 3 days of each year (version 5.1)for Washington State
created 09/21/2023 by Tim Sheehan, Alyssa Miller, Jeremy Hess
created 09/21/2023 by Tim Sheehan, Alyssa Miller, Jeremy Hess
This model characterizes the most intense future short-duration risk by considering the hottest projected three days for each reporting unit in each year between 2036 and 2065.

WA Census Tracts Heat Health Risk - 2036-2065 - Hottest 30 days of each year (version 5.1)for Washington State
created 09/21/2023 by Tim Sheehan, Alyssa Miller, Jeremy Hess
created 09/21/2023 by Tim Sheehan, Alyssa Miller, Jeremy Hess
This model characterizes the most intense future long-duration risk by considering the hottest projected thirty days for each reporting unit in each year between 2036 and 2065.
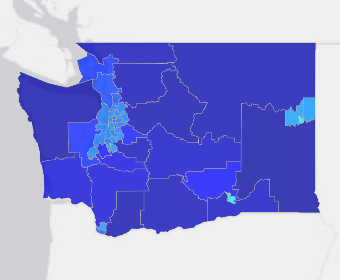
WA Legistaltive Districts Heat Health Risk - 1991-2020 - Hottest 30 days of each year (version 5.1)for Washington State
created 09/21/2023 by Tim Sheehan, Alyssa Miller, Jeremy Hess
created 09/21/2023 by Tim Sheehan, Alyssa Miller, Jeremy Hess
This model characterizes the most intense long-duration risk by considering the hottest thirty days for each reporting unit in each year between 1991 and 2020.
WA Legislative Districts Heat Health Risk - 2021-06-23 (version 5.1)for Washington State
created 09/21/2023 by Tim Sheehan, Alyssa Miller, Jeremy Hess
created 09/21/2023 by Tim Sheehan, Alyssa Miller, Jeremy Hess
This model characterizes daily heat health risk on June 23, 2021 during the heat dome event.
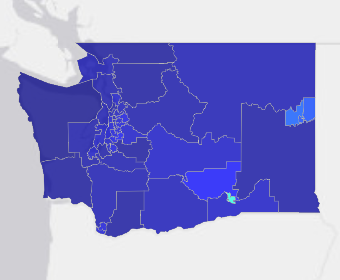
WA Legislative Districts Heat Health Risk - 1991-2020 - Hottest 3 days of each year (version 5.1)for Washington State
created 09/21/2023 by Tim Sheehan, Alyssa Miller, Jeremy Hess
created 09/21/2023 by Tim Sheehan, Alyssa Miller, Jeremy Hess
This model characterizes the most intense short-term risk by considering the hottest three days for each reporting unit in each year between 1991 and 2020.
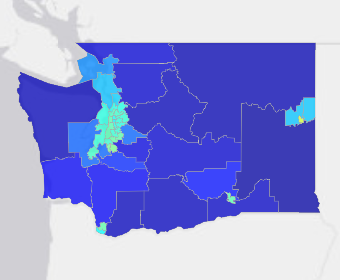
WA Legislative Districts Heat Health Risk - 2021-06-28 (version 5.1)for Washington State
created 09/21/2023 by Tim Sheehan, Alyssa Miller, Jeremy Hess
created 09/21/2023 by Tim Sheehan, Alyssa Miller, Jeremy Hess
This model characterizes daily heat health risk on June 28, 2021 during the heat dome event.
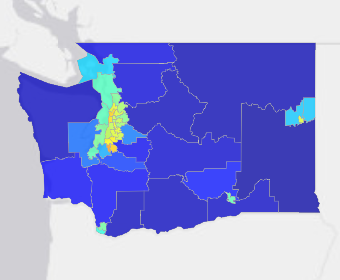
WA Legislative Districts Heat Health Risk - 2036-2065 - Hottest 3 days of each year (version 5.1)for Washington State
created 09/21/2023 by Tim Sheehan, Alyssa Miller, Jeremy Hess
created 09/21/2023 by Tim Sheehan, Alyssa Miller, Jeremy Hess
This model characterizes the most intense future short-duration risk by considering the hottest projected three days for each reporting unit in each year between 2036 and 2065.
WA Legislative Districts Heat Health Risk - 1991-2020 - Hottest 30 days of each year (version 5.1)for Washington State
created 09/21/2023 by Tim Sheehan, Alyssa Miller, Jeremy Hess
created 09/21/2023 by Tim Sheehan, Alyssa Miller, Jeremy Hess
This model characterizes the most intense future long-duration risk by considering the hottest projected thirty days for each reporting unit in each year between 2036 and 2065.
WA Census Tracts Heat Health Risk - 2021-06-23 (version 5.1)for Washington State
created 09/08/2023 by Tim Sheehan, Alyssa Miller, Jeremy Hess
created 09/08/2023 by Tim Sheehan, Alyssa Miller, Jeremy Hess
This model characterizes daily heat health risk on June 23, 2021 during the heat dome event.
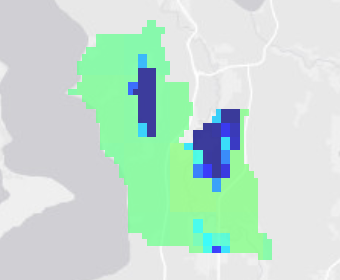
WA Legislative District 15 Heat Health Risk - 2021-06-23 (version 5.1)for Washington State
created 09/08/2023 by Tim Sheehan, Alyssa Miller, Jeremy Hess
created 09/08/2023 by Tim Sheehan, Alyssa Miller, Jeremy Hess
This model characterizes daily heat health risk on June 23, 2021 during the heat dome event.

WA Legislative District 15 Heat Health Risk - 2021-06-28 (version 5.1)for Washington State
created 09/08/2023 by Tim Sheehan, Alyssa Miller, Jeremy Hess
created 09/08/2023 by Tim Sheehan, Alyssa Miller, Jeremy Hess
This model characterizes daily heat health risk on June 28, 2021 during the heat dome event.
WA Legislative District 33 Heat Health Risk - 2021-06-23 (version 5.1)for Washington State
created 09/08/2023 by Tim Sheehan, Alyssa Miller, Jeremy Hess
created 09/08/2023 by Tim Sheehan, Alyssa Miller, Jeremy Hess
This model characterizes daily heat health risk on June 23, 2021 during the heat dome event.
WA Legislative District 33 Heat Health Risk - 2021-06-28 (version 5.1)for Washington State
created 09/08/2023 by Tim Sheehan, Alyssa Miller, Jeremy Hess
created 09/08/2023 by Tim Sheehan, Alyssa Miller, Jeremy Hess
This model characterizes daily heat health risk on June 28, 2021 during the heat dome event.

WA Legislative District 15 Heat Health Risk - 1991-2020 - Hottest 3 days of each year (version 5.1)for Washington State
created 12/05/2022 by Tim Sheehan, Alyssa Miller, Jeremy Hess
created 12/05/2022 by Tim Sheehan, Alyssa Miller, Jeremy Hess
This model characterizes the most intense short-term risk by considering the hottest three days for each reporting unit in each year between 1991 and 2020.

WA Legislative District 33 Heat Health Risk - 1991-2020 - Hottest 3 days of each year (version 5.1)for Washington State
created 12/05/2022 by Tim Sheehan, Alyssa Miller, Jeremy Hess
created 12/05/2022 by Tim Sheehan, Alyssa Miller, Jeremy Hess
This model characterizes the most intense short-term risk by considering the hottest three days for each reporting unit in each year between 1991 and 2020.