Center for Health
and the Global
EnvironmentClimate Health and Risk Tool
Center for Healthand the Global
EnvironmentClimate Health and Risk Tool


Photo: John Towner
Historical heat-related risks
1 Model
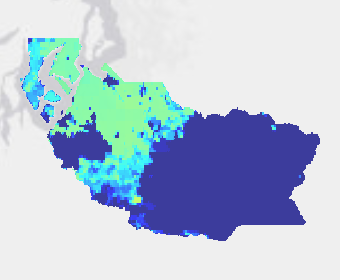
Pierce County, WA Heat Health Risk - 1991-2020 - Hottest 3 days of each year (15 arcsecond grid) (version 5.00)for Pierce County, Washington
created 03/22/2023 by Tim Sheehan, Alyssa Miller, Jeremy Hess
created 03/22/2023 by Tim Sheehan, Alyssa Miller, Jeremy Hess
This model characterizes the most intense short-term risk by considering the hottest three days for each reporting unit in each year between 1991 and 2020 for Pierce County, WA.