 Center for Health
and the Global
EnvironmentClimate Health and Risk Tool
Center for Healthand the Global
EnvironmentClimate Health and Risk Tool


CLIMATEHEALTHANDRISKTOOL
Explore potential climate-related impacts to community health using interactive decision-support modelsGlobal environmental change is impacting community health
Decision makers and community members need information about how climate-related environmental hazards like heat, storms, flooding, drought, and wildfires are likely to impact people's health.
These hazards disproportionally affect some communities more than others. Decision support models can help us understand and explore the mechanisms, magnitude, and location of these impacts in order to develop more informed plans to protect community health.


The Climate Health and Risk Tool provides an interactive way to explore how a variety of climatic, environmental, social, and economic factors contribute to climate-related hazards faced by communities. This information helps decision makers and community members develop plans to protect communities and public health under changing climate-related environmental conditions.
To get started:
About the Climate Health and Risk Tool
This tool enables you to explore the results of fuzzy models that integrate multiple community and climate measures to characterize climate-related hazards facing communities.
At the highest level, these models are based on the IPCC risk framework in which risk is defined as the combination of vulnerability, hazard, and exposure:
- Vulnerability: factors that make the effects of a hazard more or less damaging, such as social, economic, environmental, or biophysical characteristics of a community.
- Hazard: the factor that does damage, such as extreme heat or flooding.
- Exposure: the assets at risk from the hazard, such as human lives, infrastructure, or natural resources.

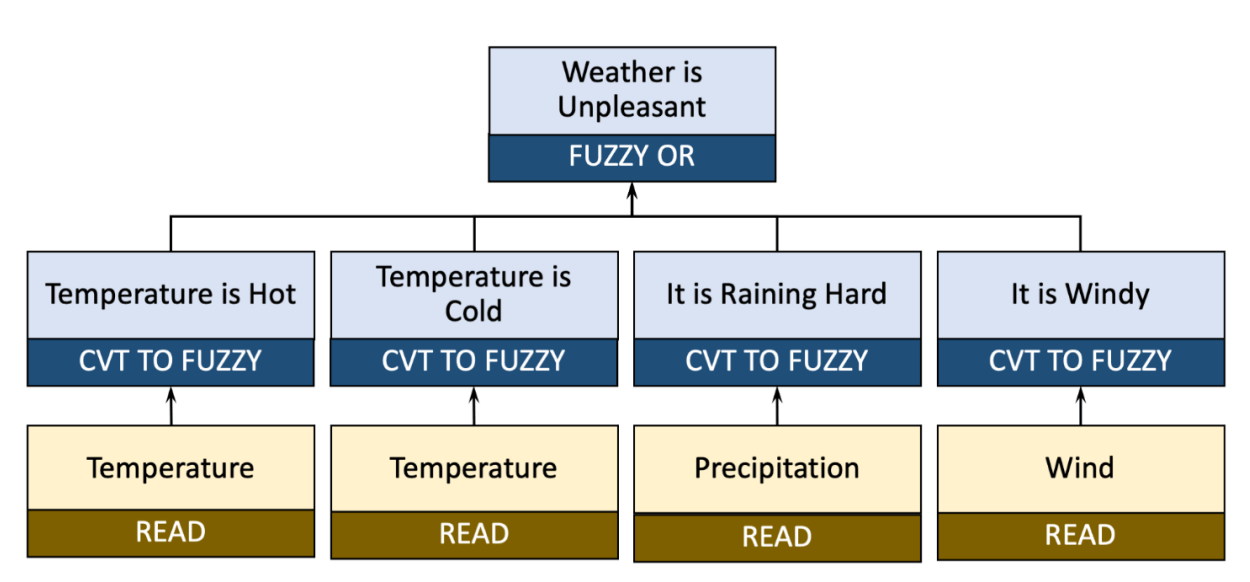
Fuzzy modeling is a tool for combining logical propositions using a hierarchical structure. For example, a proposition such as "Where is the weather most unpleasant" can be evaluated using the combination of other logical propositions, such as "Where is temperature the hottest?" and "Where is it most windy?".
Fuzzy modeling starts by transforming a each charactistic that impacts each proposition in the model from its absolute value range , such as raw population count, to its fuzzy value range, such as Falsest to Truest for the proposition "population is high".
These propositions are then combined within a model to get to progressively higher-order propositions and eventually contribute toward the overall conclusion of the model.
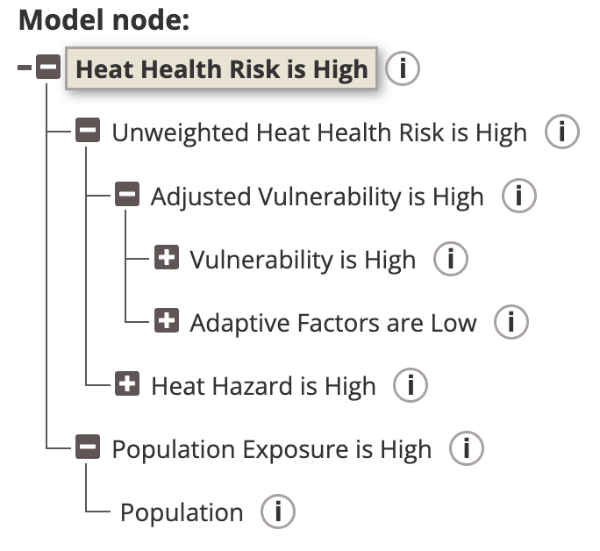
The structure of a model documents how various characteristics of a community are combined to reach an overall conclusion for the model. Each characteristic and logical proposition is represented as a "node" within the model's structure.
This structure is available in the sidebar on each model page, enabling you to "drill down" through the levels of the model and learn more about how those characteristics were combined within model.
Click the i button on the model page to learn more information about that node, including a summary and links to additional resources, where available.
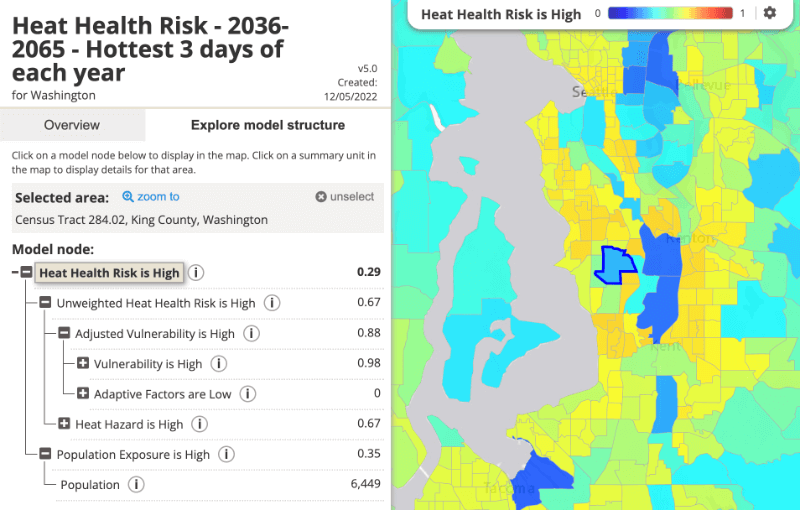
To learn more about the characteristics used in a model at a given location, click on that area in the map. The model structure will show the values for that specific area for every node in the model.
This can help you identify those characteristics that may be contributing toward a given logical proposition or the overall conclusion of the model.
Latest models
created 07/11/2023
by Tim Sheehan, Jeremy Hess
created 03/22/2023
by Tim Sheehan, Alyssa Miller, Jeremy Hess
created 09/21/2023
by Tim Sheehan, Alyssa Miller, Jeremy Hess
If you need help understanding this modeling approach, how to use this tool, or how to apply these models to your area, please contact us. We're here to help!
This tool was developed by the Center for Health and the Global Environment within the Department of Environmental and Occupational Health Sciences at the University of Washington and was made possible with the support of a CoMotion grant.