How to use the Climate Health and Risk Tool
The Climate Health and Risk Tool makes it easy to interactively explore the results of any of the fuzzy models available in the system. To learn more about fuzzy modeling concepts, please see Fuzzy Modeling 101.
You can use Explore models in the top navigation to find a model based on either topic or geography. Each topic or geography page may include additional resources at the bottom of the page to help you interpret those models.
Model details
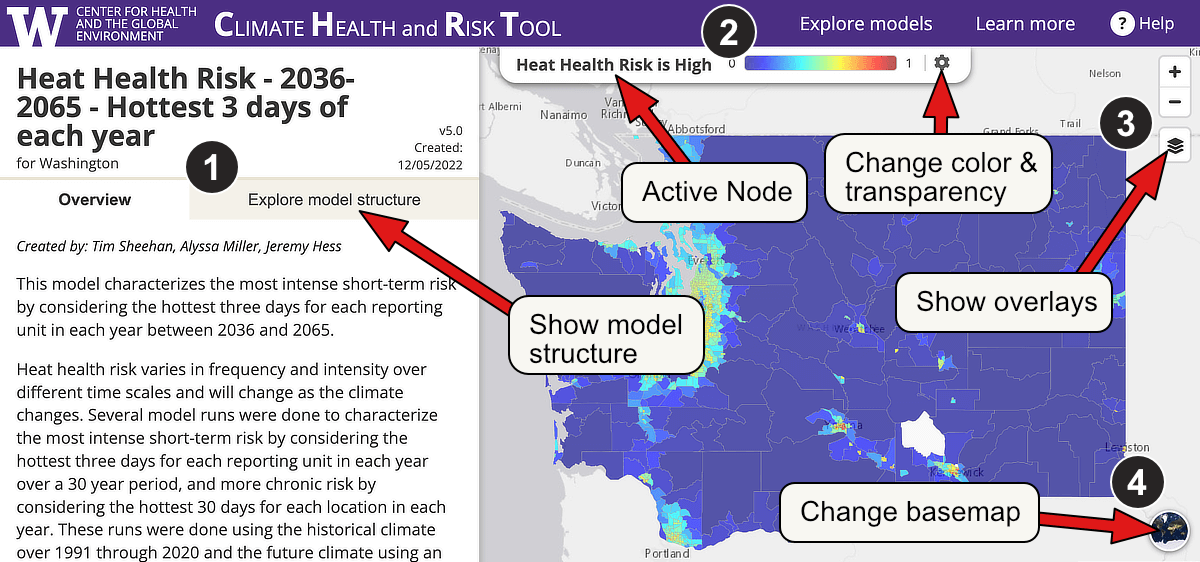
Each model includes a high-level overview of the model and an interactive map to explore results spatially:
You can use the tabs on the left sidebar to show either the model overview or display the interactive model structure diagram.
The bar above the map shows the model node that is currently displayed in the map, and includes the ability to choose from a range of color palettes or change the transparency by using the gear button.
You can display additional overlays over the top of the map, such as county boundaries by using the layers button on the upper right side.
You can choose from a range of basemaps to display underneath the model results by clicking the basemap icon on the bottom right side.
Model structure
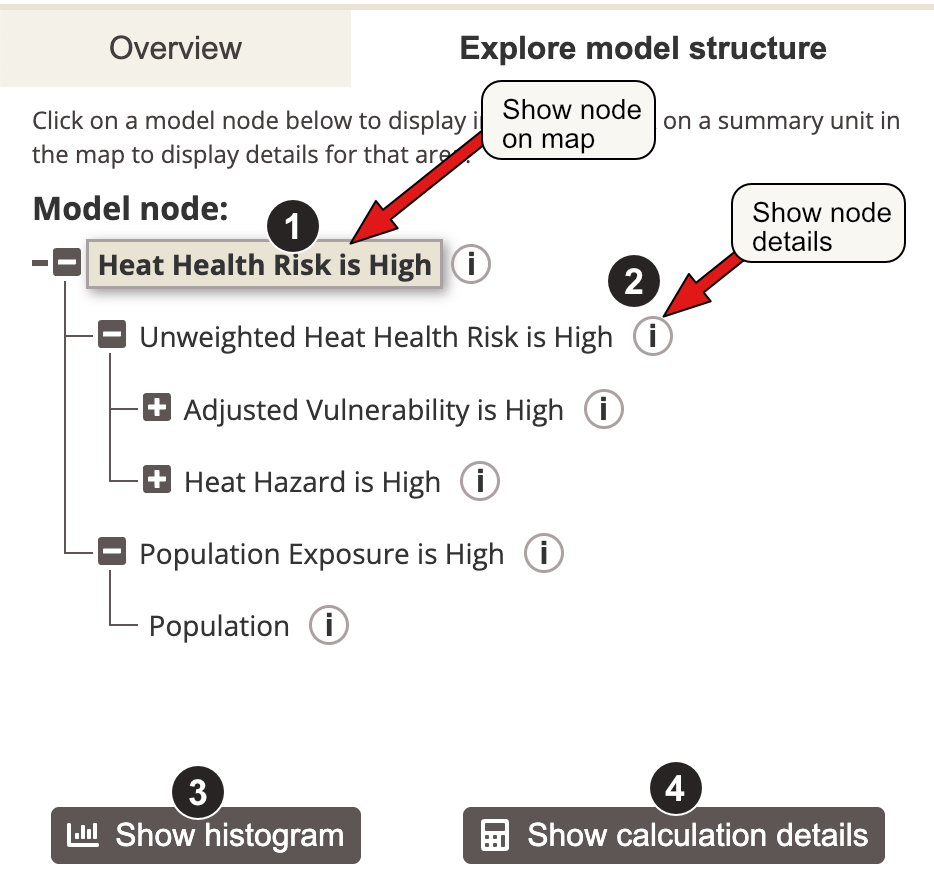
Click on the name of a node in the model structure diagram to select the node to display in the map. You can use the
[+] button to show nodes that contribute to each higher-level node and
[-] to hide them.
Click on the
(i) button to show details for a given node, including a brief description and possibly additional resources to help you interpret the results for that node.
Click on the
Show histogram button to display a histogram based on data from all analysis units in the map.
Click on the
Show calculation details button to show additional details about the calculation being performed at that node, including the operation and input data.
Model values at a location
Click on an analysis unit in the map to display values at that location for each of the model nodes in the model structure diagram.
The histogram shows the distribution of values for the node currently displayed on the map and highlights the value for the selected analysis unit.
Need help?
Please contact us (climatehealth@uw.edu) if you need help using the Climate Health and Risk Tool, need help understanding this modeling approach, or how to apply these models to your area. We're here to help!
 Center for Health