 Center for Health
and the Global
EnvironmentClimate Health and Risk Tool
Center for Healthand the Global
EnvironmentClimate Health and Risk Tool


Fuzzy Modeling 101
The Climate Health and Risk (CHaRT) models use a decision modeling approach called fuzzy logic. Fuzzy logic is a system based on natural language that recognizes that people have individualized or subjective perspectives that affect decisions - including decisions about climate and health risks. This recognition allows for "fuzziness" in assigning relationships between risk factors and in going between verbal descriptions of important terms and concepts like "risk" and and their quantification. CHaRT models use this approach because fuzzy logic:
- Allows for easy display of causal pathways for health risks
- Mimics the way people think when they make a decision
- Allows different types of data to be used together
- Provides a convenient 0 to 1 scale for quantitative results
- Makes complex decision processes easier to understand
This introduction will provide you with everything you need to understand the decision support models in CHaRT.
Yes, No, and Somewhat
People often speak using yes or no questions, but it turns out they often do not want a yes or no answer. If you ask someone, Is it cool out today?, you will not be surprised if you get an answer like one of these:
- A little
- No, it's warm
- It's freezing
- Definitely
- Kind of
- Actually, it's hot

Instead of yes or no, you're getting answers that reflect how cool it is out from the perspective of the person you're talking with. And it's important to remember that perspectives vary. Fuzzy logic is a way of dealing with decisions that require reasoning with concepts that might be expressed as yes or no (binary) but actually express a degree of trueness or falseness (fuzziness).
Another familiar example
Let's say we want to answer this question about someone: Is their income high? That is another one of those yes or no questions that, in practice, are often answered in ways that express a degree of trueness or falseness. To get at our answer we withinll start by using a common method for capturing different categories in a response, a Likert scale. First we turn the question into a statement that we will agree or disagree with:
Their income is high.
Then we will present the choices, each with a corresponding scale value:
With fuzzy logic we use the same idea, but instead of discrete classes numbered 1-5, we use a continuum from 0 to 1, and we substitute trueness and falseness for agreement and disagreement. So we end up with a scale like this:

Responses might range from 0.4 to 0.9, averaging 0.7. Formally, we might say Their income is high has a fuzzy value of 0.7. But commonly when discussing fuzzy logic results, fuzzy values are referred to as a value on a scale, High income is 0.7 or Income is 0.7.
From Value to Fuzzy Value
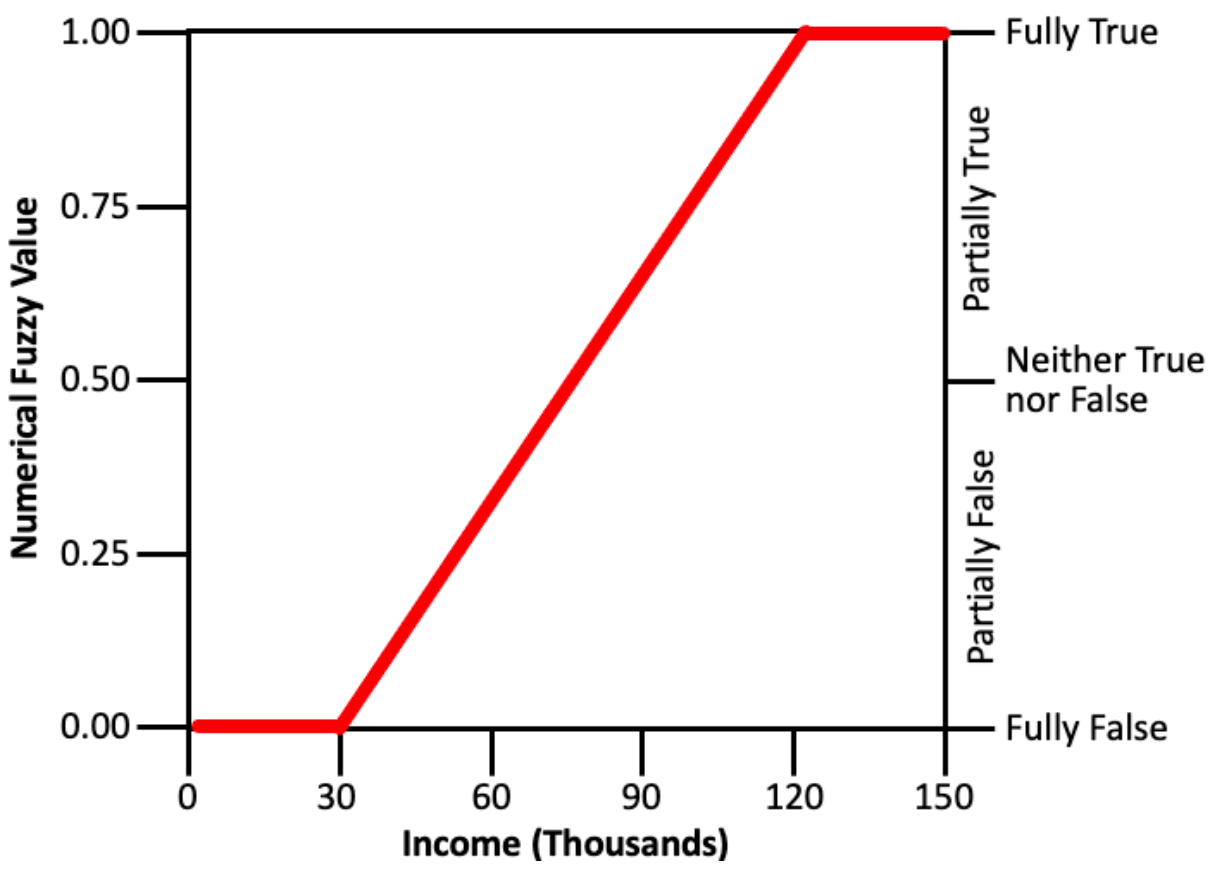
How we go from a non-fuzzy - or raw - value to a fuzzy value is one way fuzzy logic mimics how people think. Sticking with our high income example, whether Their income is high is true, false, or in between depends on context. If a real estate developer is applying for a loan to build a skyscraper, high income is going to be a lot higher than if a new car customer is applying for a car loan.
Let's stick with the case of the hypothetical new car customer. A finance company might define an annual salary of $120 thousand (or higher) as fully true (with a value of 1.0) for Their income is high, meaning anyone with income over that level will always be considered to have a high income, and $30 thousand (or lower) as fully false (with a value of 0.0), meaning noone with income below that level will be considered to have a high income. A straightforward way to fill in the values between is to use linear interpolation, which would give us this graph:
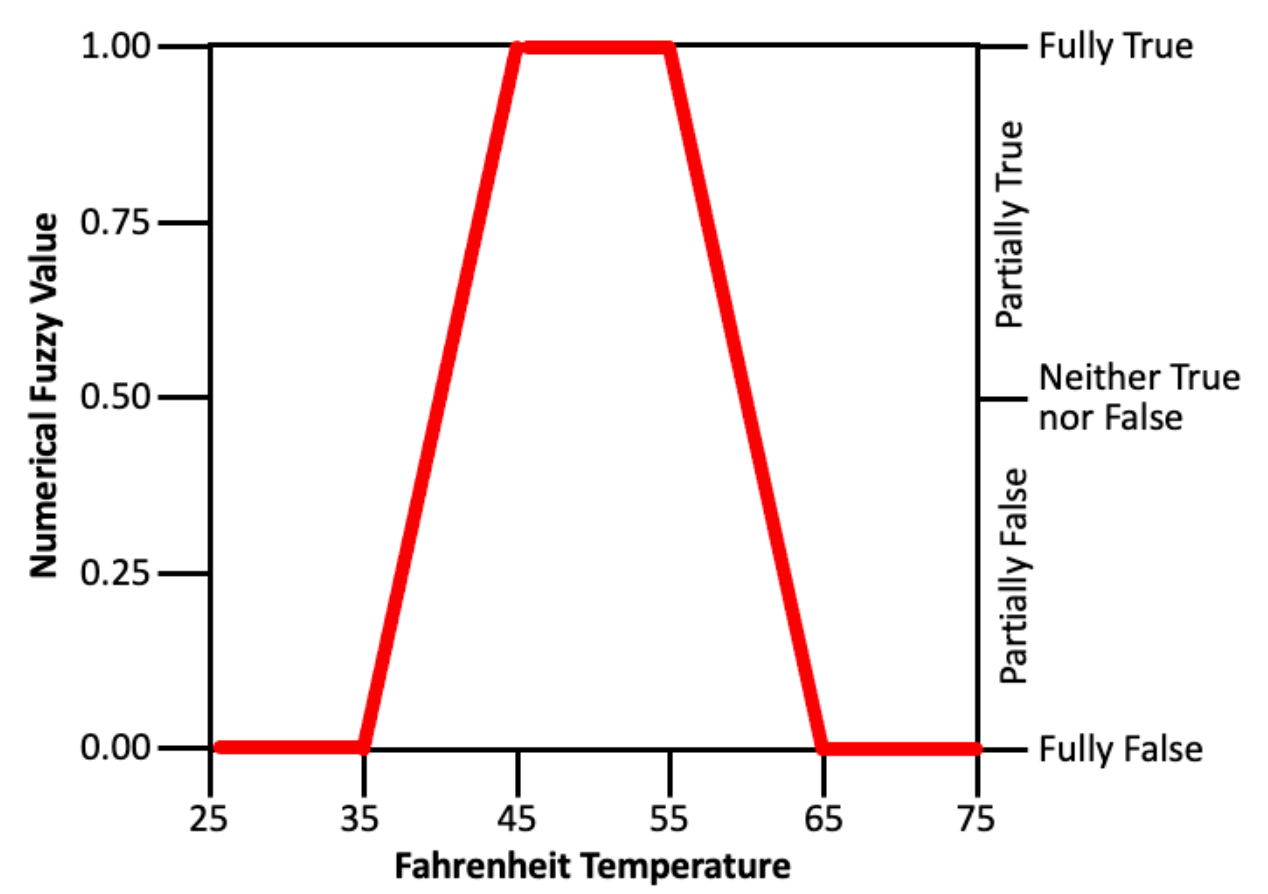
Fuzzy conversion, the process of going between raw and fuzzy values, can take any form that is useful. This example for It is cool out has fully false values on the ends and fully true values in the middle:
Complex Decisions
So far, we have shown how fuzzy logic can be used to provide a numeric scale to a single factor. But most decisions take into account multiple - sometimes hundreds - of factors. Luckily, fuzzy logic has a rich set of logic functions for combining factors in ways that mimic how we think when we make decisions. It is important to keep in mind that the result of every fuzzy logic operation is a fuzzy variable whose value will be between 0.0 and 1.0, inclusive. Also, other than operators that convert raw values into fuzzy values, all fuzzy logic operators take only fuzzy values as input.
To continue with our car loan example. To determine if a customer should get a car loan, the finance company needs to worry about both income and the amount of the down payment. The higher each of those is, the less risky making the loan will be. For Down payment is high, we will consider a down payment of $2000 or less fully false and one of $10,000 or more fully true. We will use these two factors together to determine if Customer should get a loan. We can visualize our decision logic with a simple, bottom-up logic tree:
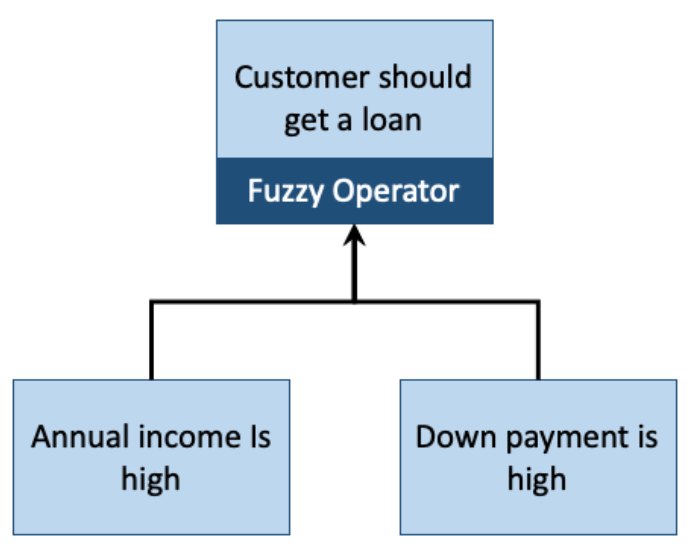
What we use for the fuzzy operator depends on how we want to make the decision, meaning how we want to relate these different concepts to support the decision we need to make. The three most common operators are OR, AND, and UNION:
- OR takes the truest of the input node values (i.e. the highest input value).
It is used when one of the input conditions is sufficient for the resulting node to be true (for instance, if we always want to give a loan to someone if their income is high or their downpayment is high, regardless of which). - AND takes the falsest of the input node values (i.e., the lowest input value).
It is used when all the input nodes are necessary for the resulting node to be true (for instance, if we want the downpayment to be high and income to be high in order to give someone a loan). - UNION takes the mean of the input node values, so all nodes influence the trueness or falseness of the resulting node.
It is used when we want to blend the factors going into the decision and we think that the average is the right blending approach.
Let us say our customer has an annual income of $60,000 and can make a down payment of $9,000. The following table shows the values and results depending on the operator we use in our example:
| Annual income is high fuzzy value | Down payment is high fuzzy value | Fuzzy logic operator | Customer should get a loan fuzzy value |
|---|---|---|---|
| 0.333 | 0.875 | OR | 0.875 |
| 0.333 | 0.875 | AND | 0.333 |
| 0.333 | 0.875 | UNION | 0.604 |
Obviously, the choice of fuzzy operator has a big influence on the result.
Additional Operators
There are a number of other fuzzy logic operators. CHaRT uses two of these, so we will cover those in a bit of detail.
The first is WEIGHTED UNION. It is simply a weighted average of the input node values, with weights provided by the modeler when they create the model. If the originator of car loans felt a large down payment was twice as important as a person's income, then they might create a model using a WEIGHTED UNION with a weight of 2 for the down payment and weight of 1 on the annual income.
Finally there is the SELECTED UNION. This operator takes the UNION of a subset of the input node values. It either uses the highest or lowest n (subset) of m (all) nodes. Say our loan originator was looking at all these factors:
- Annual income is high
- Credit score is high
- Down payment is high
- Family member will cosign
- Trade-in is valuable
- Employment history is stable
A fully true value for each one of these factors indicates that the loan applicant has a lower risk of defaulting on the loan. But few, if any, applicants will have high values for all these factors. The model could use the SELECTED UNION to average the highest three of those factors to produce a result.
Understanding Fuzzy Model Results
Just as we apply some interpretation when we convert a raw value into a fuzzy value, we have to interpret the results of a fuzzy model. This may be as simple as classifying the results from their 0 to 1 range. For example, for a car loan model above, we might decide that a result of 0.75 means the applicant is a low risk and that we should grant the loan; a result between 0.5 and 0.75 indicates a moderate risk and we should examine the applicant's credit history; between 0.25 and 0.5 is a high risk and we should require a cosigner; and less than 0.25 is an extreme risk and we should not grant the loan.
Other cases may have a more numeric interpretation, in which case a function can be applied to the result to yield a non-fuzzy result. This process is called defuzzification.
Putting It All Together
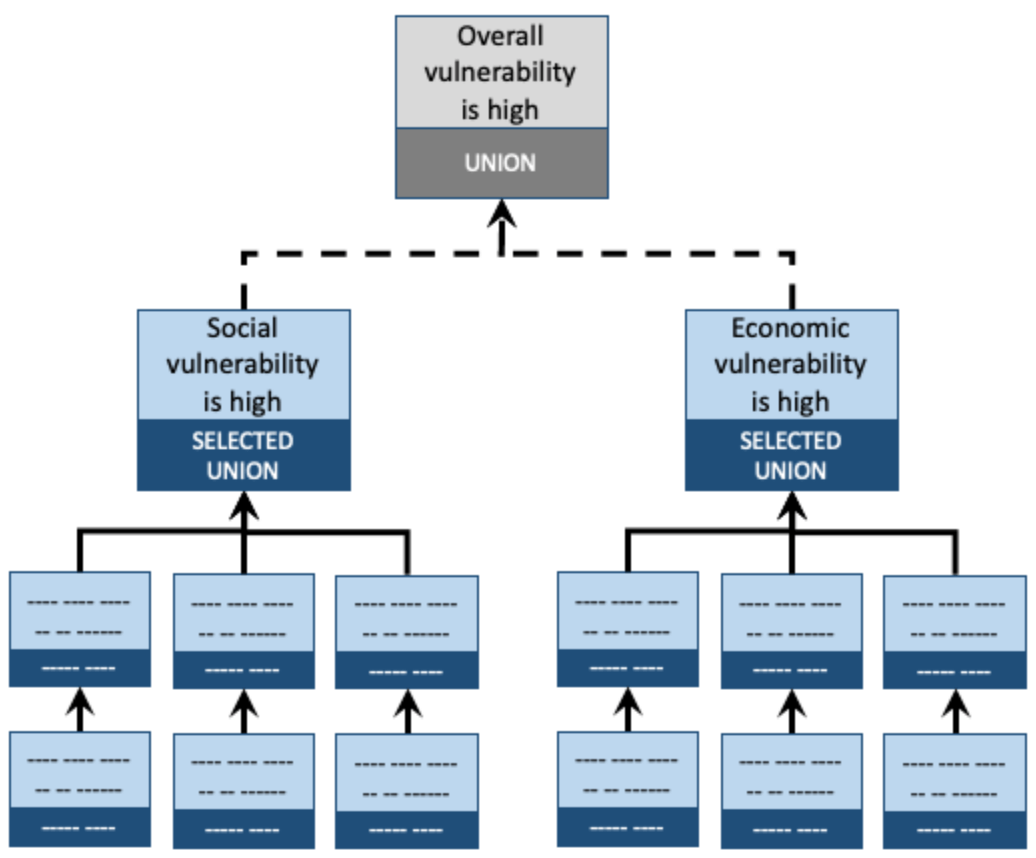
Because fuzzy logic operators take fuzzy logic values as input and produce fuzzy logic values as a result, two or more existing fuzzy logic models can be combined into a more complex one by creating a node that combines the results from those two models.
For example, we might combine an existing social vulnerability model with an existing economic vulnerability model to create a new overall vulnerability model:
When you think about it, each node in a fuzzy logic model is its own model built from all the nodes below it, and provides a value for its associated statement. A branch (a node with all its contributing nodes) from one model can be copied to stand on its own or to be used as part of another model.
Spatial Models
By itself, fuzzy logic has no concept of spatial data. However, CHaRT uses a framework called MPilot to apply fuzzy logic models to spatial data. For instance, think of a state divided into census tracts. Independent of one another, census tracts have values for income, population, age, etc. MPilot allows us to build a fuzzy logic model and apply that model independently to each census tract. It produces a map for each node in the model. By exploring those maps, decision makers can understand how census tracts compare to one another and what lower level factors drive higher level results.
For example, these maps show how factors for heat health risk relate to one another for a model run over Washington State.

The pathway from the lowest level drivers of top level values is termed the causal pathway. The causal pathway varies between locations. For instance, poverty may contribute to vulnerability in one census tract while a high number of workers may contribute in another. If decision makers want to implement effective intervention strategies, local causal pathways will help them understand which interventions are most appropriate where. Modeling methods that do not expose causal pathways make targeting interventions much more difficult.
Conclusion
We hope this brief introduction has given you an understanding of fuzzy logic modeling. As you explore the rest of CHaRT, you will see how we have used fuzzy logic to build models to quantify risks, and you will be able to explore those models to understand the drivers of risk at a local level, where the most effective decisions are made.